Published 2012-08-04.
Time to read: 4 minutes.
I was investigating how to push notifications from JVM-based programs when I found the NagiosAppender project. Push notifications are termed ‘passive checks’ because Nagios does not poll for results. For the curious, see the Nagios Plugins – Passive Service Check section of Application Monitoring Made Easy for Java Applications Using Nagios.
NagiosAppender integrates Log4j or Logback with Nagios’ optional NSCA server.
The only ‘programming’ required is setting up configuration files for Nagios client and Nagios server, adding a new dependency,
and writing appropriate log messages for forwarding to Nagios by the plugin.
Unfortunately, NagiosAppender is not compatible with Akka because
it uses MDC,
which uses ThreadLocal variables,
which should not be used with Akka.
I took the NagiosAppender project, slimmed it down, removed the Log4j interface and the MDC code, and created the
PushToNagios project.
NB: The document mentions MDC without defining it. From the Apache log4j docs: “A Mapped Diagnostic Context, or MDC, is an instrument for distinguishing interleaved log output from different sources. Log output is typically interleaved when a server handles multiple clients near-simultaneously. The MDC is managed on a per-thread basis. A child thread automatically inherits a copy of the mapped diagnostic context of its parent.” The Logback documentation has a whole chapter on MDC.
NSCA
NSCA is a Nagios add-on that allows you to send passive check results from remote hosts to the Nagios daemon running on the monitoring server. This is very useful in distributed and redundant/failover monitoring setups. The NSCA addon can be found on Nagios Exchange. For more information, see Addon – Nagios Passive Checks with NSCA.

Installation
For Ubuntu:
$ sudo apt-get install nagios3 nsca
Installs Nagios Core 3.2.3, which is outdated but compatible, and nsca 2.7.2+nmu2, which is current.
The current version of Nagios Core is 3.4.1, released on 2012-05-14.
Nagios starts automatically after installation, but NSCA needs to be started manually (don't do that yet, keep reading).
Navigate your web browser to http://localhost/nagios3
and specify userid nagiosadmin.
FYI, /etc/init.d/nagios3 contains:
DAEMON=/usr/sbin/nagios3
NAGIOSCFG="/etc/nagios3/nagios.cfg"
CGICFG="/etc/nagios3/cgi.cfg"
/etc/nagios3/nagios.cfg contains:
log_file=/var/log/nagios3/nagios.log
cfg_file=/etc/nagios3/commands.cfg
cfg_dir=/etc/nagios-plugins/config
/etc/nagios3/resource.cfg contains:
# Sets $USER1$ to be the path to the plugins
$USER1$=/usr/lib/nagios/plugins
/etc/init.d/nsca contains:
DAEMON=/usr/sbin/nsca
CONF=/etc/nsca.cfg
OPTS="--daemon -c $CONF"
PIDFILE="/var/run/nsca.pid"
We saw above that plugins are in /usr/lib/nagios/plugins/.
I added one called check_domain_bus with permissions set to 755, and owned by nagios:nagios:
#!/bin/sh
echo "All OK: $1"
exit 0
Configuration
Edit /etc/nagios3/nagios.cfg and enable external commands on line 145 so the entry looks like this:
check_external_commands=1
Edit the last line of /etc/nsca.cfg to disable encryption:
decryption_method=0
Define a new Nagios command called check_domain_bus in /etc/nagios3/commands.cfg by adding the following anywhere in that file:
define command {
  command_name check_domain_bus
  command_line $USER1$/check_domain_bus $ARG1$
}
Define a template for passive services, and an instance of a passive service called domainBus that responds to the check_domain_bus
command by adding the following to /etc/nagios3/conf.d/services_nagios2.cfg:
define service {
       name                    passive-service
       use                     generic-service
       check_freshness         1
       passive_checks_enabled  1
       active_checks_enabled   0
       is_volatile             0
       flap_detection_enabled  0
       notification_options    w,u,c,s
       freshness_threshold     57600     ;12hr
}

define service {
    use                     passive-service
    host_name               localhost
    service_description     domainBus
    check_command           check_domain_bus!0
}
Usage
Start NSCA server, then restart Nagios:
$ sudo service nsca start
$ sudo service nagios3 restart
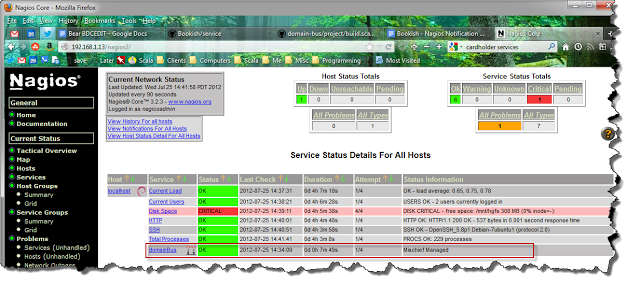
The custom service, called domainBus, should be viewable as a Nagios service, shown in the red rectangle below:

Nagios will need to be restarted each time a service definition is modified.
New services are shown as PENDING until they receive their first result.
Passive services have no scheduled updates.
Testing with the PushToNagios Java Client
See the PushToNagios documentation.
Testing With the Compiled C NSCA Client
Let’s send a message and have the result displayed on the web interface.
send_nsca is a
compiled C nsca client
that can be used to send a test message.
Unpack nsca-2.7.2.tar.gz into a directory, and compile it:
$ ./configure

$ make install
Again, edit the last line of sample-config/send_nsca.cfg and change it to read:
decryption_method=0
Create a test message in the root of the unpacked NSCA project. The format for a service check packet using NSCA contains tab characters and ends in a newline, like this:
<hostname>[tab]<svc_description>[tab]<return_code>[tab]<plugin_output>
I am unsure if <hostname> refers to the Nagios host or the sending host.
The allowable values for <return_code> are:
0 - OK state

1 - Warning state

2 - Error state

3 - Unknown state
<plugin_output> can be up to 512 bytes long.
Create a text message called testCritical, with embedded tabs, that NSCA uses as a field delimiter.
localhost domainBus 2 This is a Test Error
Watch the Nagios log and syslog in one console:
$ tail -f /var/log/nagios3/nagios.log /var/log/syslog
Send the test message like this in another console; let's call this the command console:
$ src/send_nsca localhost -c sample-config/send_nsca.cfg < testCritical
Notice the log output in the console with the log output:
==> /var/log/nagios3/nagios.log <==
[1343251589] EXTERNAL COMMAND: PROCESS_SERVICE_CHECK_RESULT;localhost;domainBus;2;This is a Test Error

==> /var/log/syslog <==
Jul 25 14:26:29 natty nagios3: EXTERNAL COMMAND: PROCESS_SERVICE_CHECK_RESULT;localhost;domainBus;2;This is a Test Error

==> /var/log/nagios3/nagios.log <==
[1343251590] PASSIVE SERVICE CHECK: localhost;domainBus;2;This is a Test Error

==> /var/log/syslog <==
Jul 25 14:26:30 natty nagios3: PASSIVE SERVICE CHECK: localhost;domainBus;2;This is a Test Error

==> /var/log/nagios3/nagios.log <==
[1343251590] SERVICE ALERT: localhost;domainBus;CRITICAL;SOFT;1;This is a Test Error

==> /var/log/syslog <==
Jul 25 14:26:30 natty nagios3: SERVICE ALERT: localhost;domainBus;CRITICAL;SOFT;1;This is a Test Error
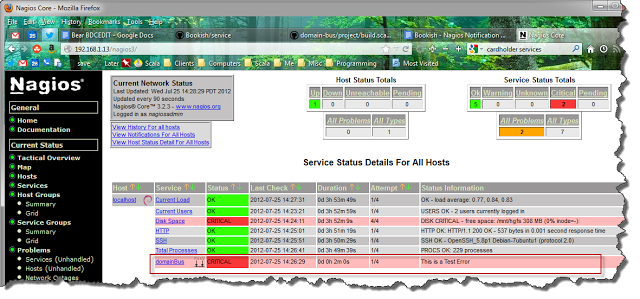
In the web browser, click on Services again and notice that the status of the domainBus service is now CRITICAL,
and Status Information now reads:
This is a Test Error

Create a text message called testClear, and do not forget the embedded tabs:
localhost domainBus 0 Mischief Managed
Send this new test message in the command console:
$ src/send_nsca localhost -c sample-config/send_nsca.cfg < testClear
The log output console should show something like this:
==> /var/log/nagios3/nagios.log <==
[1343252049] EXTERNAL COMMAND: PROCESS_SERVICE_CHECK_RESULT;localhost;domainBus;0;Mischief Managed

==> /var/log/syslog <==
Jul 25 14:34:09 natty nagios3: EXTERNAL COMMAND: PROCESS_SERVICE_CHECK_RESULT;localhost;domainBus;0;Mischief Managed

==> /var/log/nagios3/nagios.log <==
[1343252050] PASSIVE SERVICE CHECK: localhost;domainBus;0;Mischief Managed
[1343252050] SERVICE ALERT: localhost;domainBus;OK;SOFT;2;Mischief Managed

==> /var/log/syslog <==
Jul 25 14:34:10 natty nagios3: PASSIVE SERVICE CHECK: localhost;domainBus;0;Mischief Managed
In the web browser, the Services information should automatically update after a pause of up to 90 seconds (by default),
or you can click on Services to immediately see the new status.
Notice that the status of the domainBus service is now OK, and Status Information now reads Mischief Managed.

The third possible message status is warning.
Create a text message called testWarning and do not forget the embedded tabs:
localhost domainBus 1 Do you know where your chocolate is?
Send the test message like this in the command console:
$ src/send_nsca localhost -c sample-config/send_nsca.cfg < testWarning
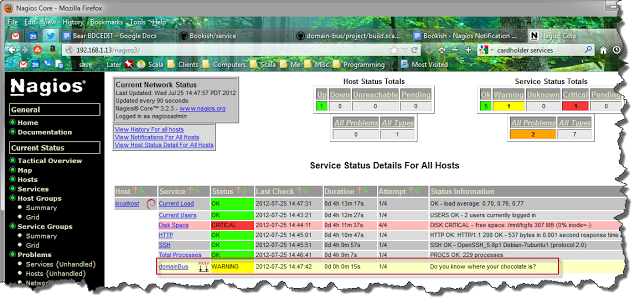
In the web browser, click on Services to immediately see the new status.
Notice that the status of the domainBus service is now OK, and Status Information now reads
Do you know where your chocolate is?


